Demokurs: Introduction to Engineering Mathematics
1. Functions
1.7. Exercises


Tasks for Chapter 1 "Functions"
Task 1: Parabolas I
The graphs of the functions \(f\), \(g\) with \(f(x) = ax^2+ bx + c\) and \(g(x) = d(x-e)^2+ h\) should show the samme parabola. What is the relationship between the variables \(a\), \(b\), \(c\), \(d\), \(e\) and \(h\)?
Task 2: Parabolas II
We consider the parables \(\P_b) with the equation \(f(x) = 2x^2+ bx + 1\), \(b \in \mathbb{R}\).
- Determine the vertex \(S_b\) of the parabolas \(P_b\) (thus depending on \(b\)).
- Draw - for example with the help of the program GeoGebra (downloadable free of charge from http://www.geogebra.at) the locus line \(OS_b\) on which the vertex of \(P_b\) moves when \(b\) is varied. A screenshot of this task should be included in the solution of the task.
- Determine the equation for the locus line \(OS\).
Task 3: Exponential function
- Compare the two functions with \(y = a \cdot 2^x\) and \(y = 2^{(x+d)}\) for different values \(a,d \in \mathbb{R}\). For which \(a\) or \(d\)-values do the graphs of the two functions match?
- The general exponential function can be calculated with the equation \(f(x) = a \cdot b^{cx+d}\) with \(a,c,d \in \mathbb{R}; b \in \mathbb{R}^+\). This equation is equivalent to an equation with only three parameters \(A,B,C\) where \(A,B,C \in \mathbb{R}\) or \(\mathbb{R}^+\). Give the relationship between \(A,B, C\) and \(a,b,c,d\).
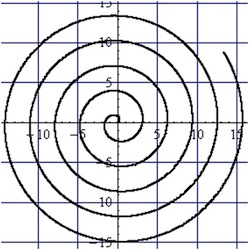
Task 4: Spiral
Draw the curve \(K(t) = (t \cdot \cos(t), t \cdot \sin(t))\) for \(0 < t < 20\). The curve can be thought of as resulting from a movement and dynamically interpreted, if \(t\) is understood as time. This curve is called a spiral.
- Describe this movement!
- Specify the equation of the shown spiral!
Task 5: Ellipse
Given is an ellipse \(E(x,y): \frac{x^2}{a^2} + \frac{y^2}{b^2} = 1\); \(a,b \in \mathbb{R}^+\). Specify the equation of the tangent to the ellipse in the ellipse point \(P(x_0,y_0)\).
Note: Start from the circle \(K_a: x^2+ y^2= a^2\) and create \(E\) by stretching or compressing \(K_a\) by the factor \(\frac{b}{a}\) parallel to the \(y\)-axis. Then start from a circle tangent.
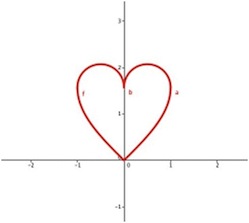
Task 6: The heart
There are different possibilities how to draw a heart using mathematical functions. In particular a heart can have many different forms. Using function pieces (in GeoGebra) draw a heart shape. The image on the right shows one example of how it can be achieved.
Task 7: Function of two variables
- Describe the graph \(G\) of the function \(f(x,y) = x^2+ y^2\) by cutting \(G\) with selected planes and describing the resulting figures.
- Consider the two planes \(f(x,y) = 4x + y + 3\) and \(g(x,y) = -x + 3y - 5\) in a joint coordinate system. Show that these two planes are perpendicular to each other.