Demokurs: Introduction to Engineering Mathematics
1. Functions
1.5. Multivariable Functions

This section describes how functions of two variables are defined and gives some examples.

Functions of Two Variables
Functions that depend on more than one variable are called multivariable functions. The easiest examples of multivariable functions are functions of two variables.
The domain \(D\) of functions of two variables is a subset of the \(xy\)-plane. Every point \((x_0, y_0)\in D\) on this plane is associated with a point with \(z\)-coordinate \(\left(x_0,y_0,z_0\right)\). Formally a function of two variables is described as follows: \[\begin{aligned}f : D \subseteq \mathbb{R}\times\mathbb{R} &\to \mathbb{R} \\ (x,y) &\mapsto f(x,y)\end{aligned}\]
Introductory example: Saddle (surface)
We imagine a three-dimensional coordinate system. Every point \((x_1,y_1)\) on the \(xy\)-plane is associated with the point \((x_1,y_1,z_1)\) where \(z_1=x_1\cdot y_1\).
If \(x\) is fixed, we have an equation of a line: \[z = const. \cdot y\] For example with \(x=2\) we obtain \(z=2\cdot y\). The equations describe straight lines, which run parallel to the \(yz\)-plane.
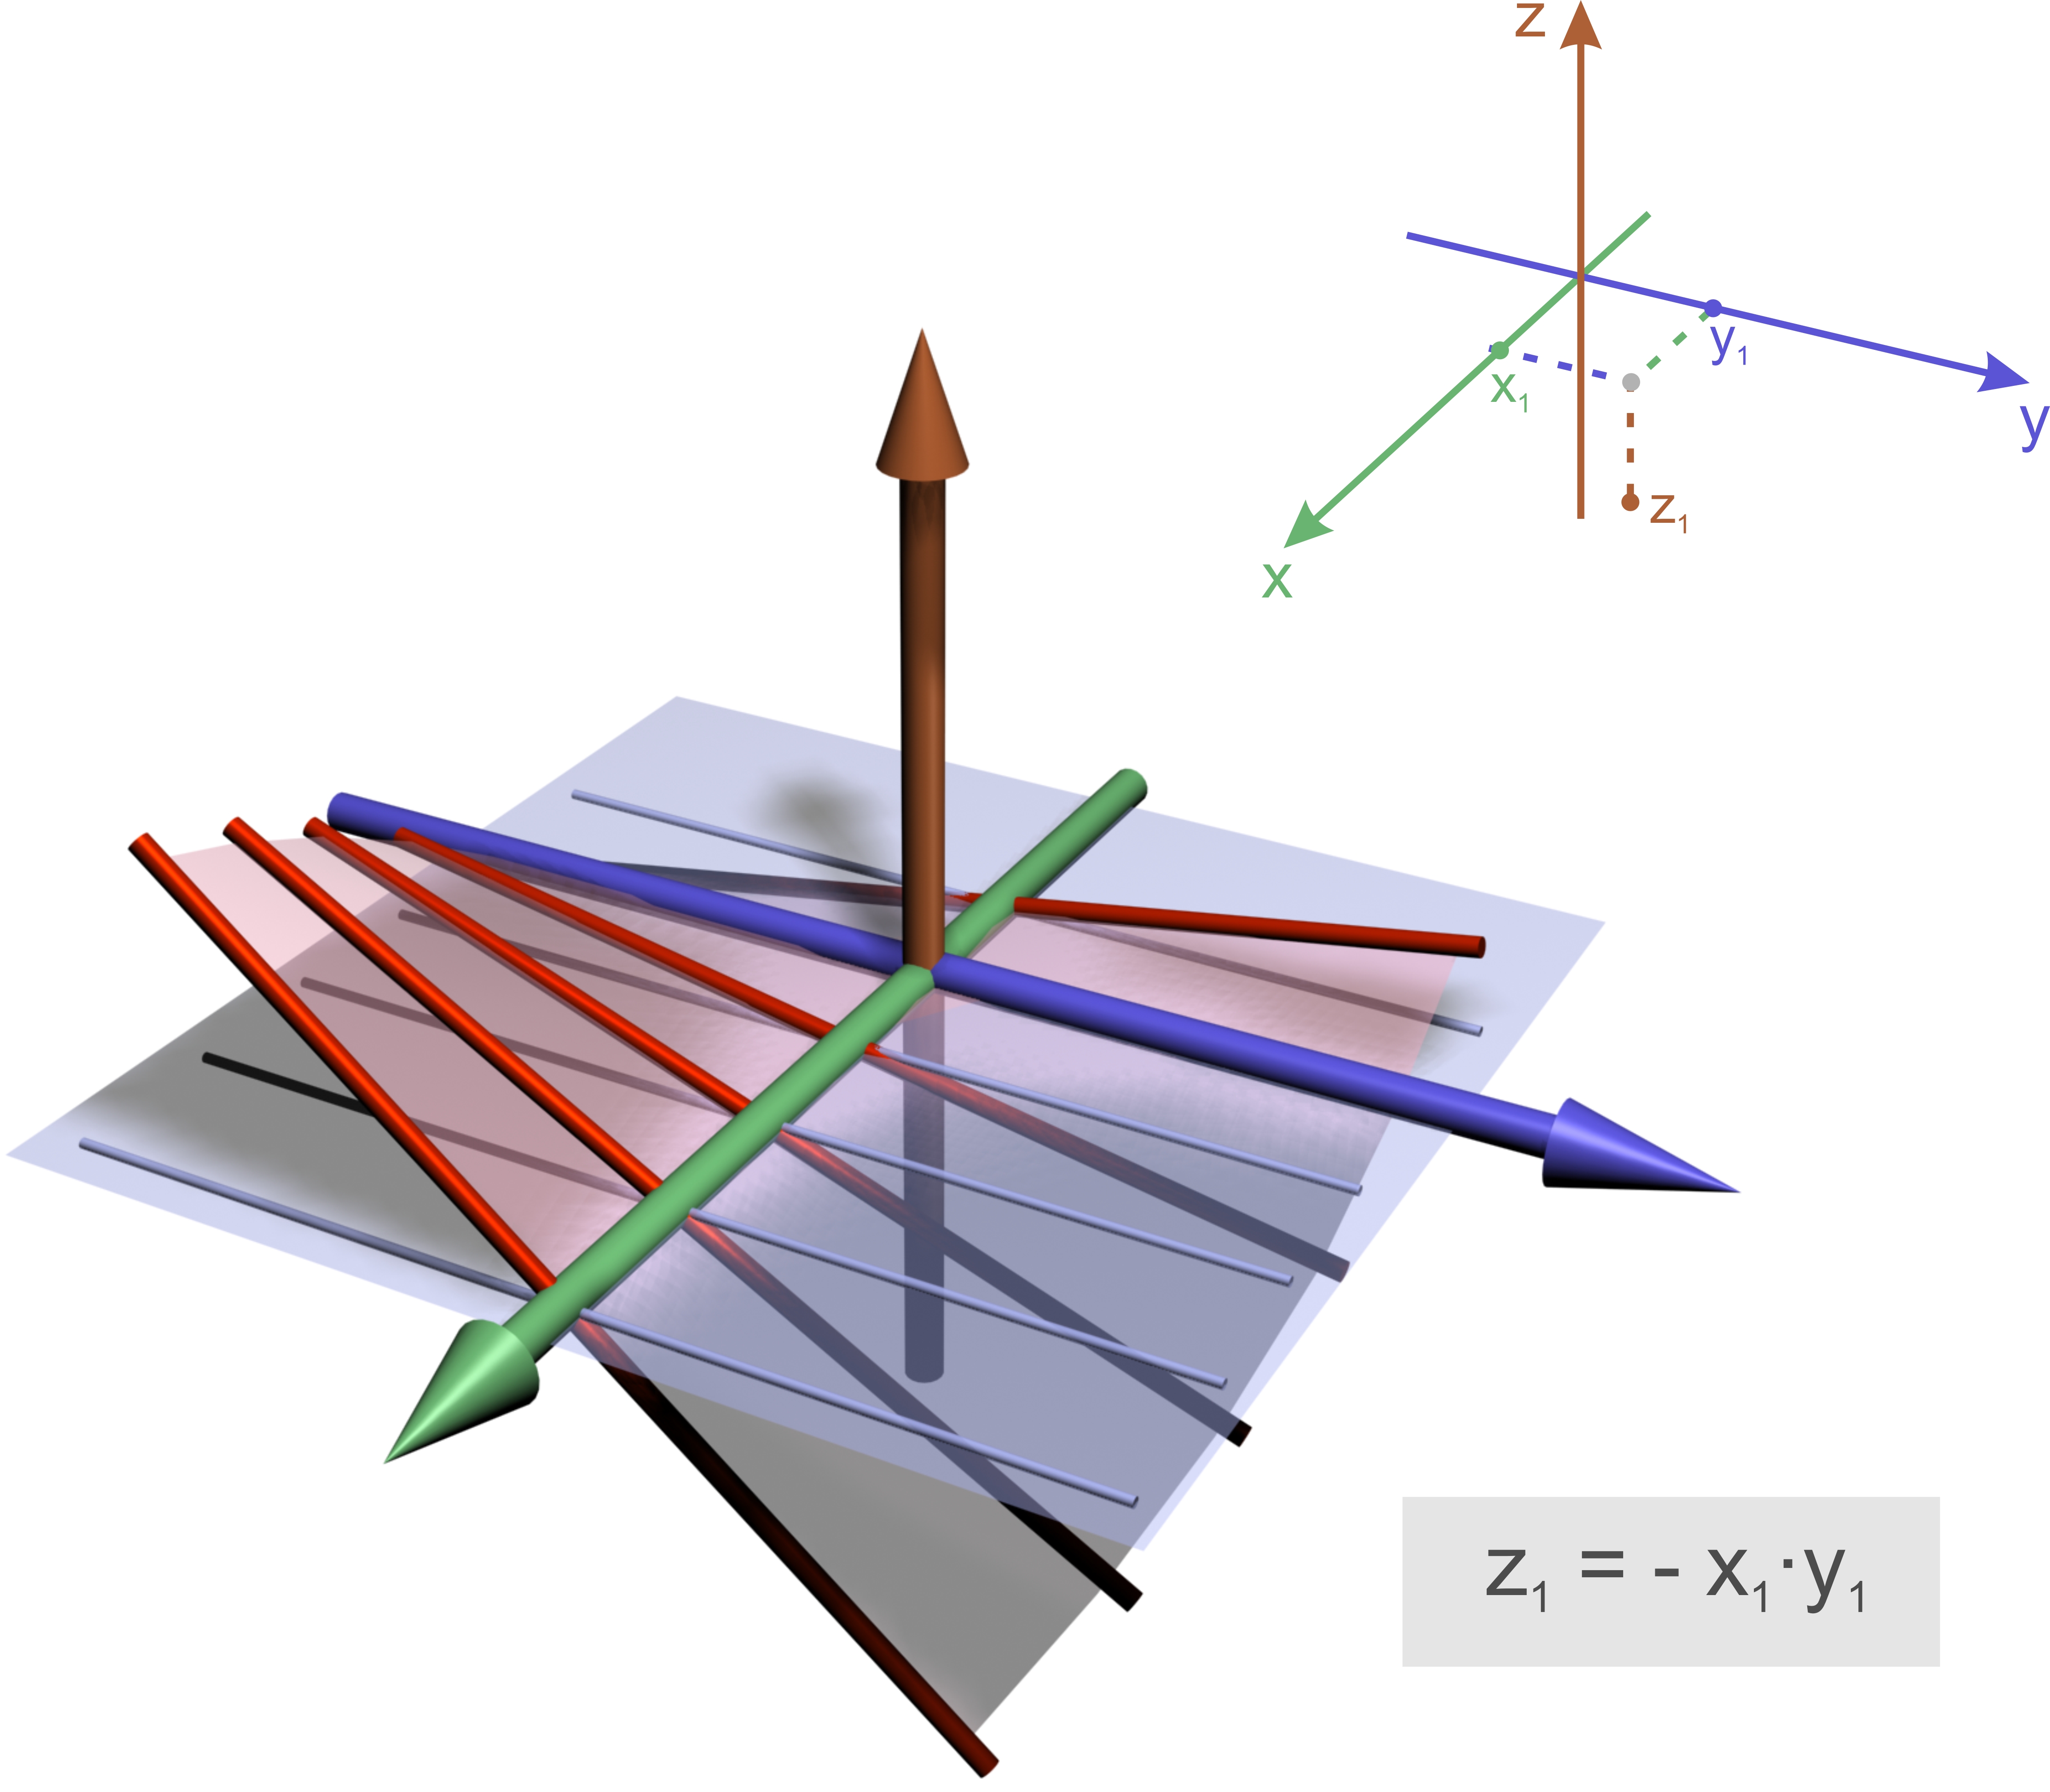
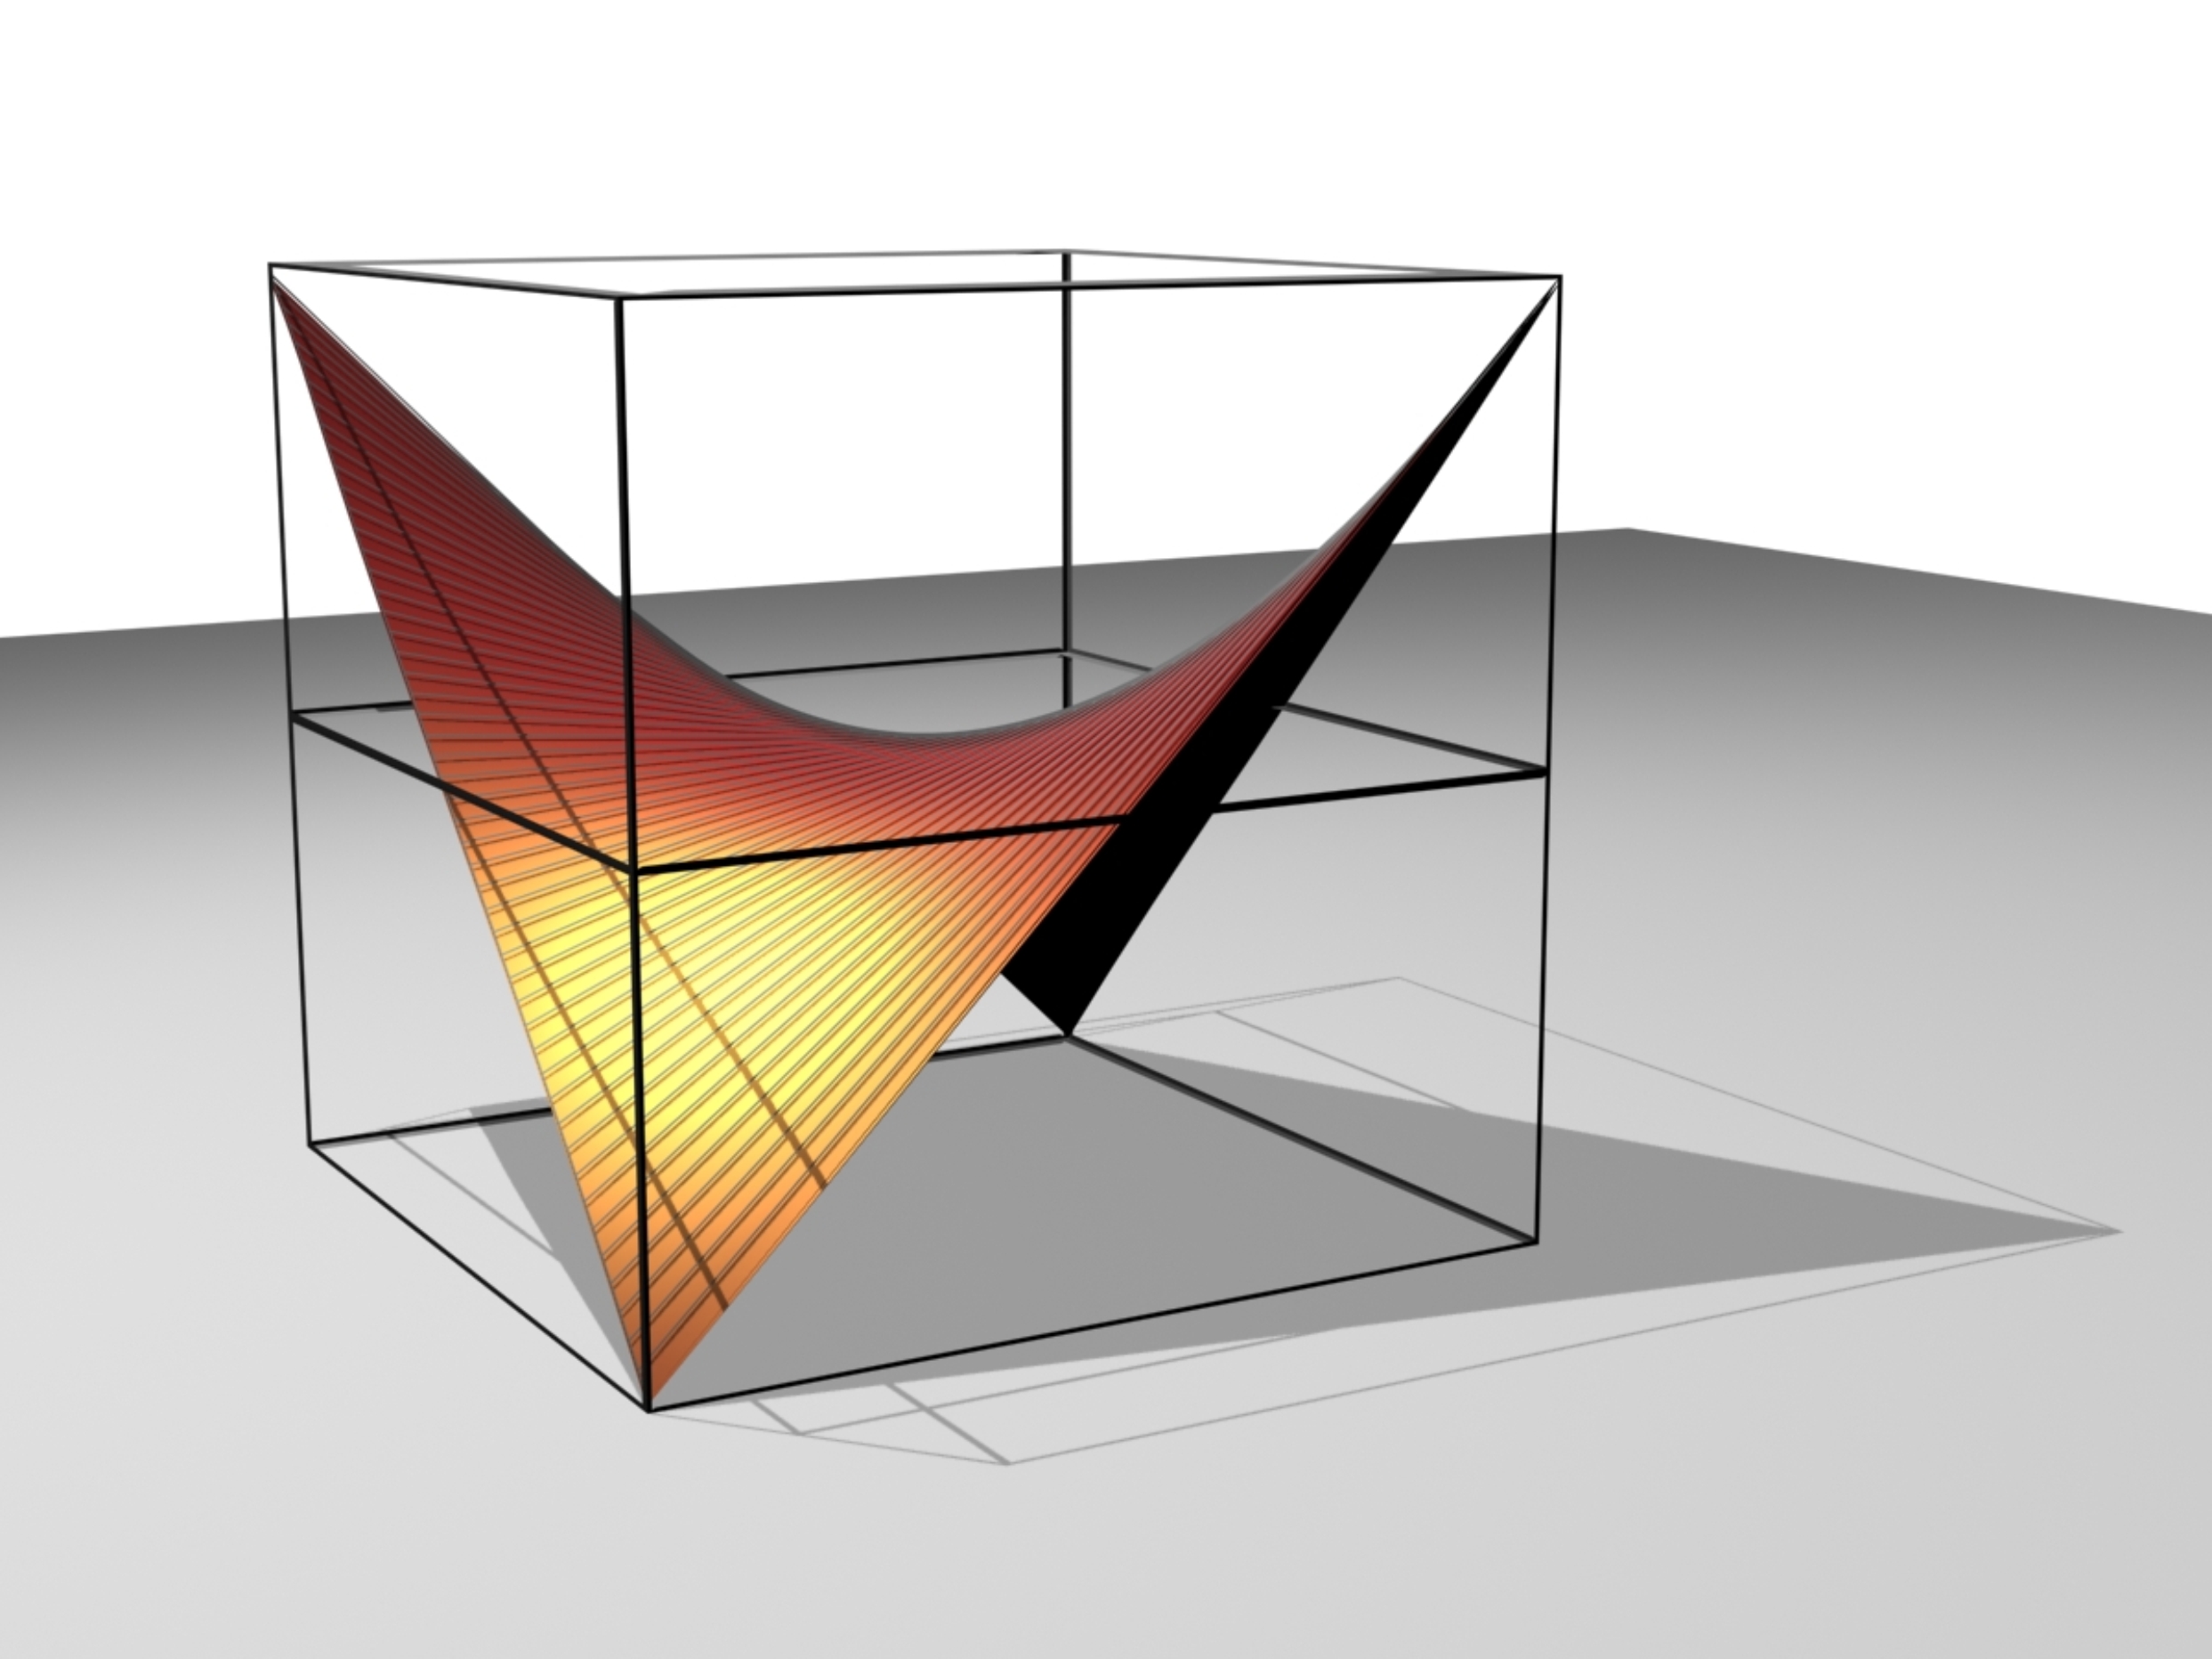
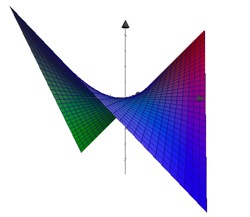
If we vary \(x\) we get a family of straight lines which generates a surface, the so-called saddle (surface).
In general we call every surface generated by the movement of a straight line, a ruled-surface.
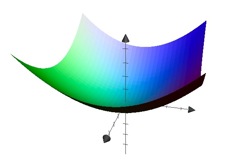
Example: Paraboloid
We consider the function \[f(x,y)=x^2+y^2\]

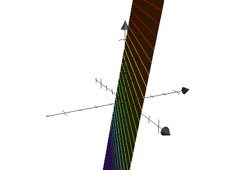
Exercise: Linear functions
We consider the equation \[z(x,y) = 2x + 5y\] Show that the graph of the function is represented by a plane, when you input fixed values of \(x\) (or of \(y\)), e.g. \(x=\{-2, -1, 0, 1, 2\}.\)
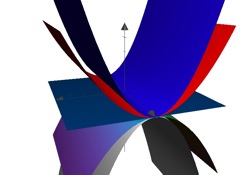
Example: Families of curves
\[f_a(x)=f(a,x)=a\cdot x^2\] In this particular 'function of two variables' the variables are \(x\) and the parameter of the family \(a\). Further example: \(f_a(x) = a\cdot \sin(x)\) is regarded as \(f(a,x) = a\cdot \sin(x)\) or as \(f(x,y) = y\cdot \sin(x)\). The diagram on the right shows the graph of the function \(z=a \cdot x^2\) for \(a=\{-2,...,2\}\).
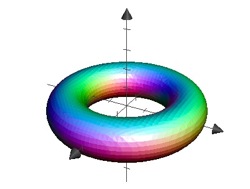
Example: Torus
The equation \[\left(\sqrt{x^2+y^2}-R\right)^2+z^2-r^2=0\] describes a torus. We can picture this as a circle with radius \(r\), which is rotated at a distance \(R\), around the \(z\)-axis. The \(z\)-axis is an axis of symmetry and the \(xy\)-plane a plane of symmetry to the torus.
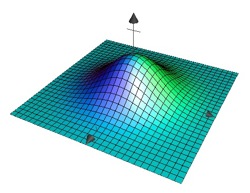
Example: The Bell Curve
The graph of the function \[z=C\cdot e^{-a^2\left(x^2+y^2\right)}\] with constants \(a,C\in \mathbb{R}\) resembles a bell. It is symmetric to the \(z\)-axis.